Measuring AI's actual ROI: the attribution trap that fools everyone
Bottom line: After you deploy AI, proving it delivered value is far harder than it looks, and the difficulty cuts both ways — it is easy to claim credit the AI never earned, and just as easy to miss value it genuinely created. The trap is attribution: connecting an outcome to the AI rather than to everything else that changed at the same time. Real measurement climbs a ladder from weak evidence to strong, and only the top rung — the counterfactual — actually proves the AI caused the result. Most "AI ROI" stops three rungs short and calls it proof.
Everyone is measuring AI ROI. Almost no one is measuring it honestly.
Ask an organization whether its AI investment is paying off and you will get an answer, often a confident one, backed by a dashboard. Usage is up. People say it helps. A metric moved after launch. The case looks made. But press on the logic and it tends to dissolve, because almost none of what gets presented as AI ROI actually establishes that the AI caused the value — it establishes that the AI exists, is being used, and was present when something good happened, which is a very different and much weaker claim. The confidence is real; the evidence underneath it usually is not.
This matters more than it might seem, because the failure is bidirectional and both directions are expensive. Overclaiming — crediting the AI for gains it did not cause — leads to pouring money into systems that are not actually working, defended by metrics that were never evidence. Underclaiming — missing value the AI genuinely created because it did not show up in the obvious place — leads to killing systems that were quietly working. The widely-cited finding that the large majority of enterprise AI pilots show no measurable return to the profit-and-loss statement is, in part, a measurement failure as much as a value failure: a lot of these systems were never measured in a way that could detect their value if it existed, or rule it out if it did not. The crux of AI ROI is not the return. It is the attribution.
Most AI ROI establishes that the AI was present when something good happened. That is not the same as establishing that the AI caused it — and the gap is where the money is lost.
The question isn't "did the metric move." It's "did the AI move it."
The single conceptual error underneath bad AI measurement is treating correlation as attribution — observing that a metric improved after the AI was deployed and concluding the AI improved it. But an enormous number of things change in any organization at any time: other initiatives launch, the market shifts, seasonality turns, the team that adopted the AI was also the team that was most motivated to improve. A metric moving after launch is consistent with the AI having caused all of the improvement, some of it, none of it, or with the AI having actually hurt while something else more than compensated. "The metric moved" simply does not distinguish between these, and most AI ROI never asks it to.
The honest question is harder and more specific: not "did the metric move" but "did the AI move it" — what would have happened without the AI, and how much of the change is attributable to it rather than to everything else. This is a question about causation, not correlation, and causation is genuinely hard to establish, which is precisely why most measurement quietly substitutes the easy question for the hard one. But the easy question's answer, however well-dashboarded, is not evidence of value. Only the hard question's answer is, and getting it requires climbing a ladder most ROI claims never start.
The Value Attribution Ladder
Evidence that AI delivered value comes in grades, from weakest to strongest, arranged as a ladder.
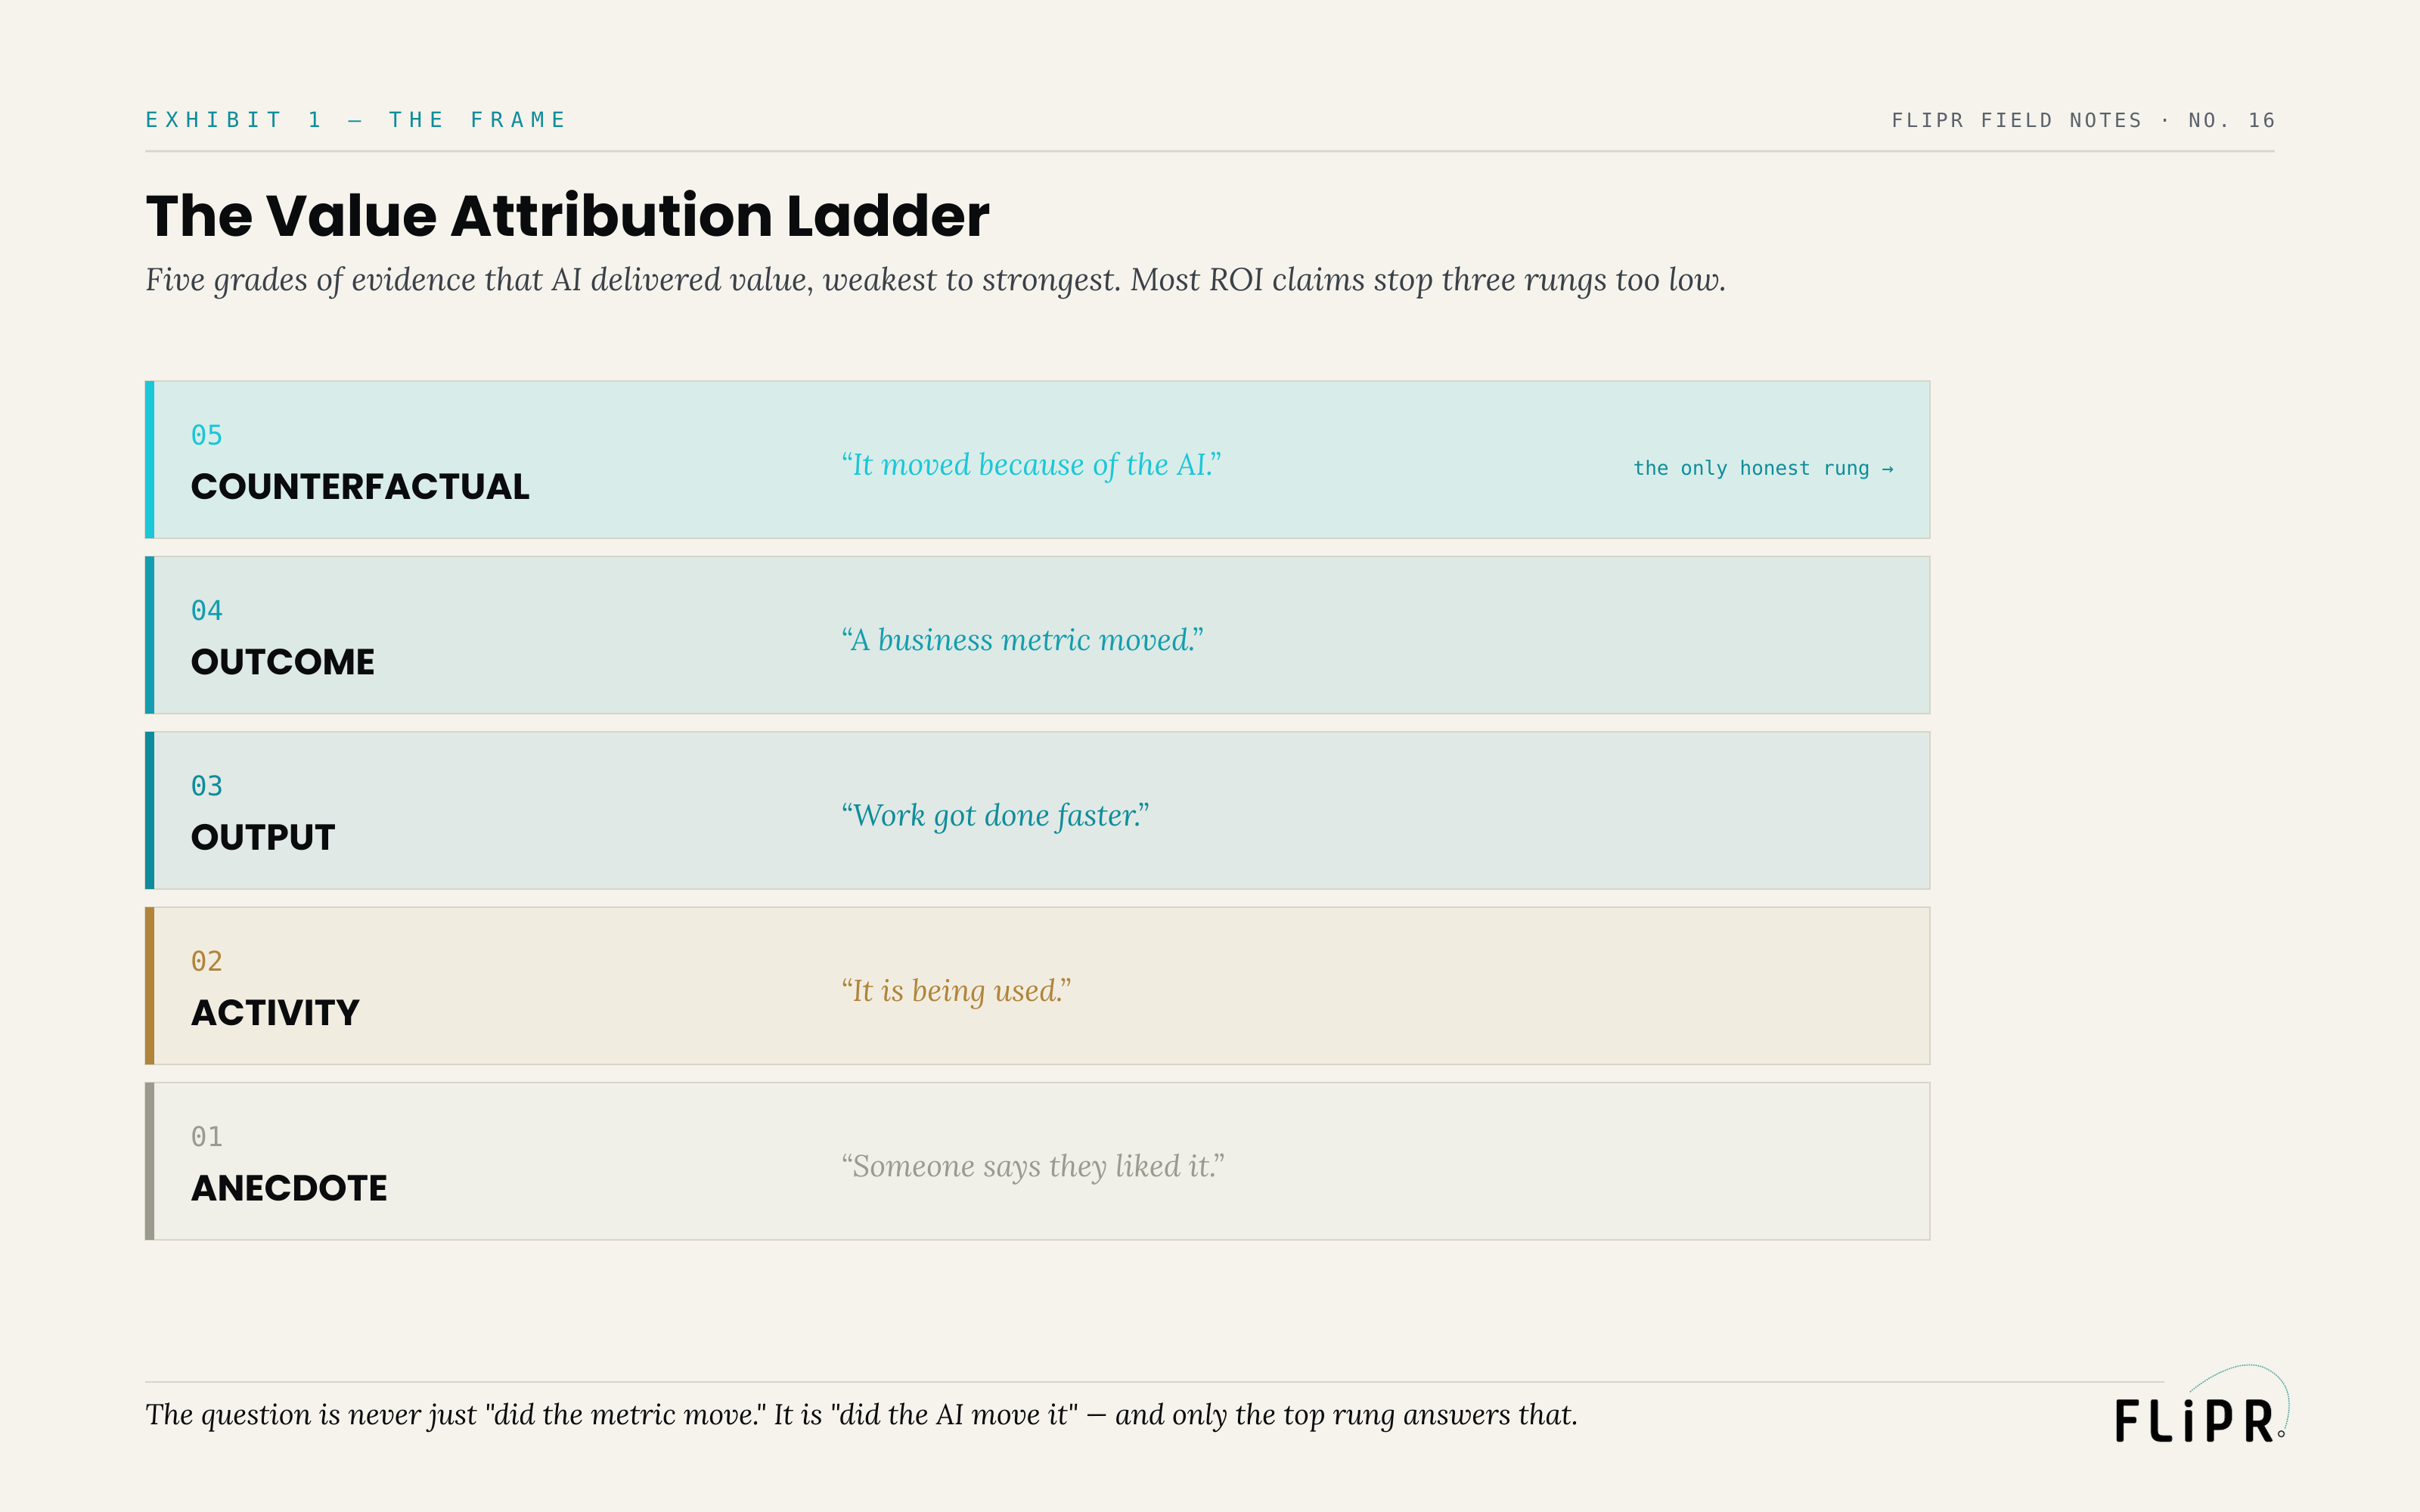 Exhibit 1. Five grades of evidence that AI delivered value, weakest to strongest. Most ROI claims stop three rungs too low.
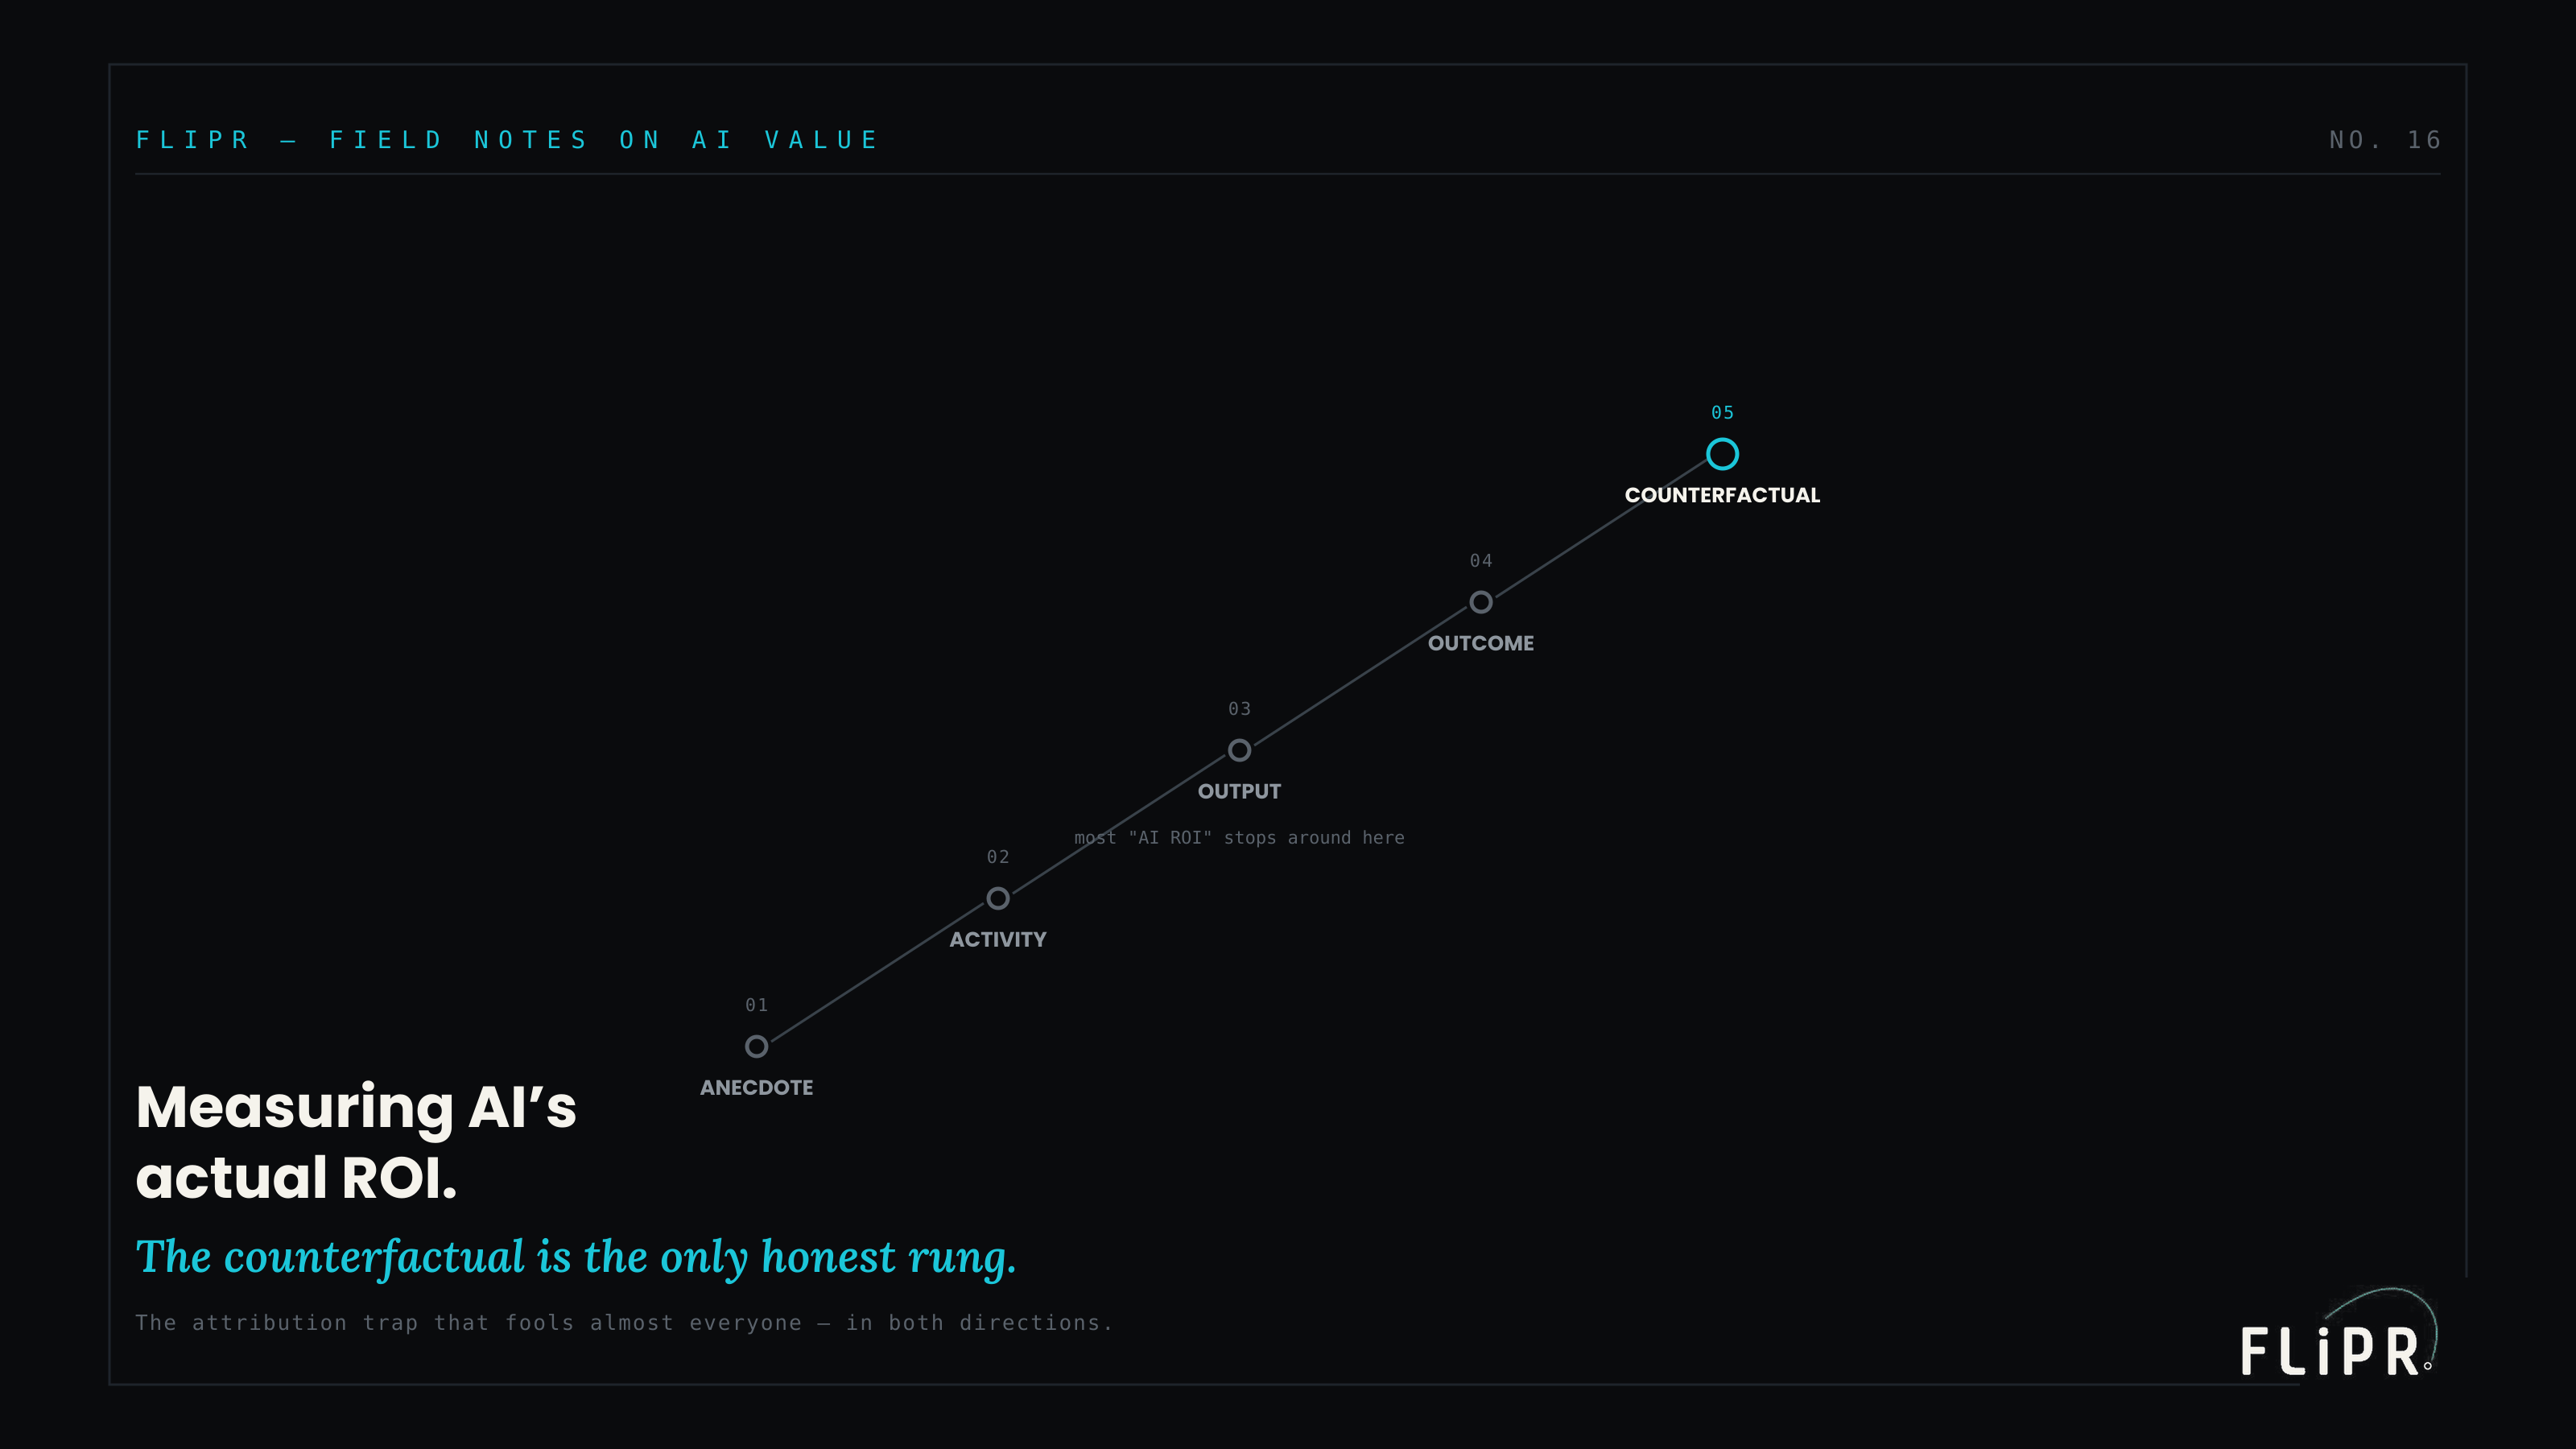
The bottom rung is anecdote: someone says they liked it. Above it, activity: the system is being used. Above that, output: work got done faster or cheaper. Above that, outcome: a business metric moved. And at the top, counterfactual: the metric moved because of the AI, established against what would have happened without it. Each rung is stronger evidence than the one below, and the jump that matters most is the last one — from outcome to counterfactual — because every rung below the top is consistent with the AI having delivered no value at all. Usage can be high for a mandated tool nobody finds useful. Output can be faster without any business result. A metric can move for reasons that have nothing to do with the AI. Only the counterfactual rung — comparing against a world, or a group, where the AI was absent — actually rules out the alternative explanations and isolates the AI's contribution.
Most AI ROI lives on the second or third rung, activity or output, and is presented as if it were the fourth or fifth. The dashboard shows usage and faster task completion, and the deck calls it value delivered. The ladder makes visible exactly how far that claim has to climb before it earns the word "proof."
Every rung below the top is consistent with the AI having delivered nothing. Only the counterfactual rules that out — which is why it is the only rung that honestly says "value."
What each rung proves — and doesn't
The diagnostic value of the ladder is that each rung names exactly what it shows and, just as importantly, what it does not.
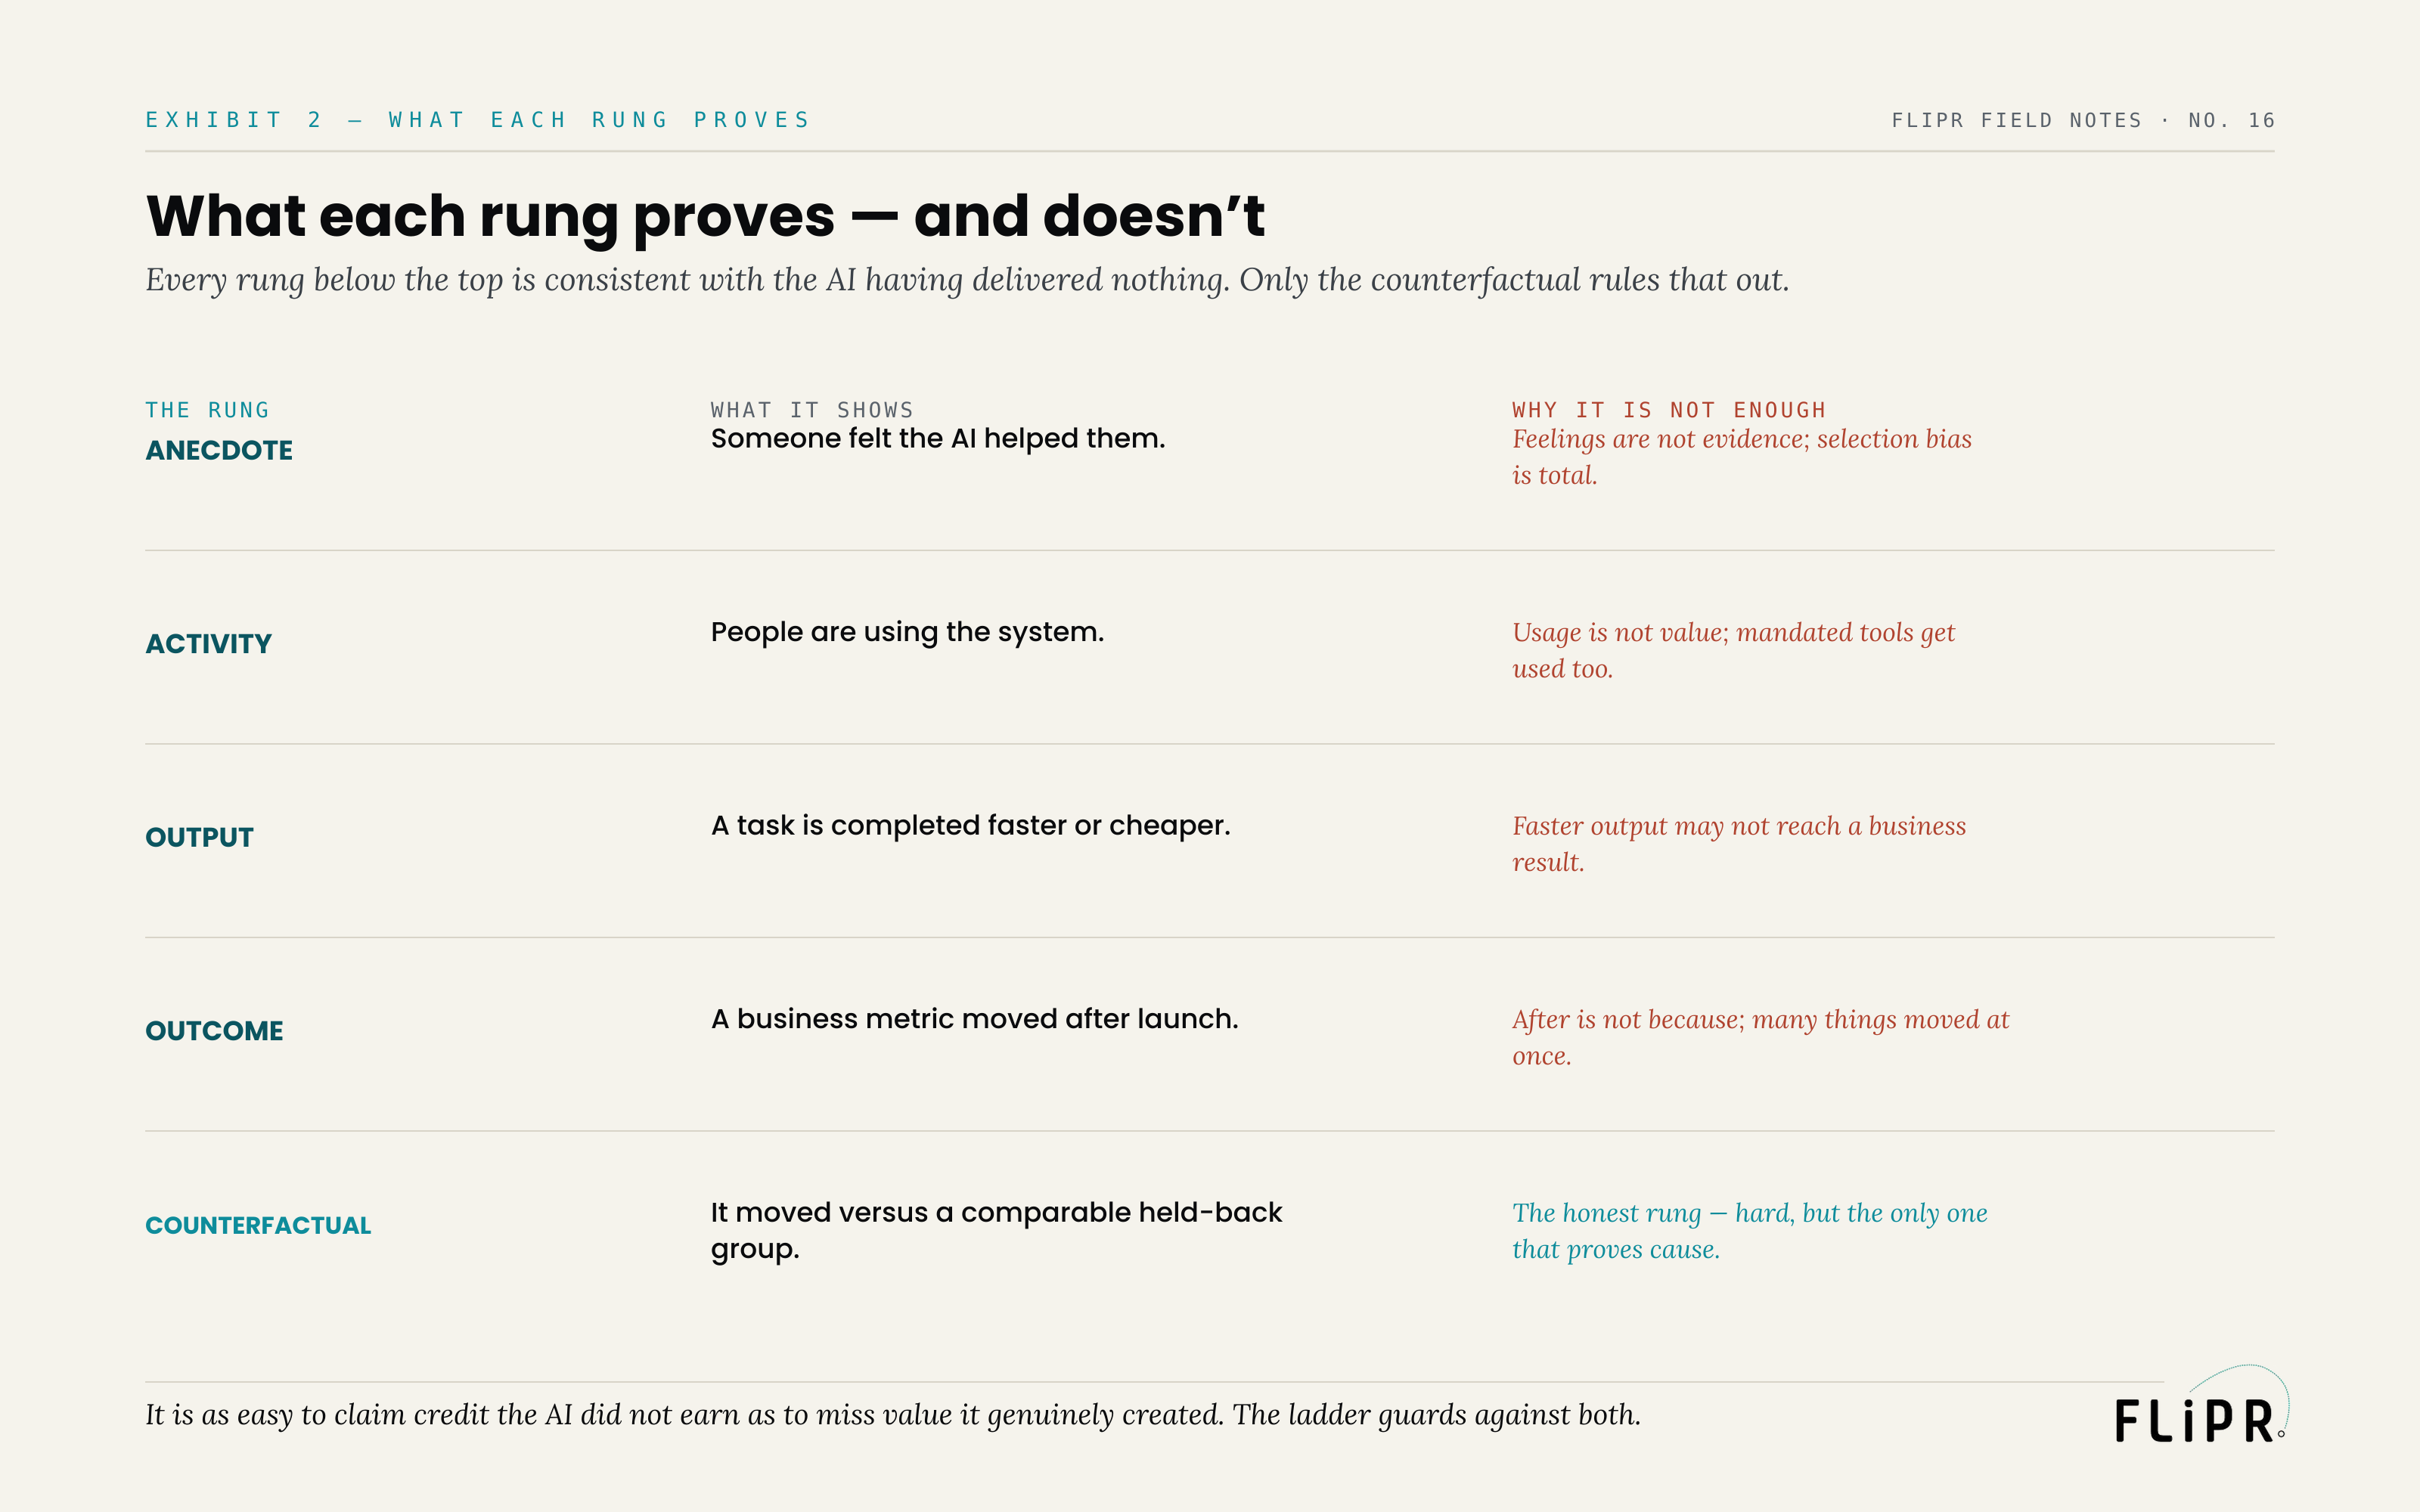 Exhibit 2. Every rung below the top is consistent with the AI having delivered nothing. Only the counterfactual rules that out.
Anecdote shows that someone felt the AI helped — but feelings are not evidence, and the selection bias is total, because the people who volunteer praise are not a random sample. Activity shows that people are using the system — but usage is not value, and mandated tools get used regardless of whether they help. Output shows that a task is completed faster or cheaper — but faster output may never translate into a business result, if the bottleneck was elsewhere. Outcome shows that a business metric moved after launch — but after is not because, and many things moved at once. Only counterfactual shows that the metric moved relative to a comparable group or period where the AI was held back — the hard rung, and the only one that actually proves cause. The pattern is that each lower rung is consistent with the AI being worthless; you can have enthusiastic anecdotes, high usage, faster output, and a moving metric, and still have an AI that contributed nothing, with all the apparent value coming from elsewhere. The counterfactual is what closes that gap, and nothing below it can.
The practical consequence is uncomfortable: a great deal of what organizations report as AI ROI would not survive the question "compared to what." The ladder is a way to ask that question rigorously, and to know which rung your evidence is actually standing on.
What this looks like on Monday
Set two ROI cases side by side, for the same deployment. (This is an illustration, not an account of any specific engagement.)
 Exhibit 3. One reports activity and calls it value; one measures against a counterfactual. Illustrative, not a client account.
The first reports activity and calls it value. Its claim is "adoption is high, so the AI is delivering value," and its evidence is usage dashboards and a few happy quotes. When challenged, it cannot separate the AI's effect from everything else that was happening, because it never set up any way to. Its risk is bidirectional and large: it may be crediting the AI for gains it did not cause, or missing real ones, and it has no way to tell which — the number it reports is flattering and unfounded in equal measure.
The second measures the counterfactual. Its claim is "versus a held-back group, the AI moved the metric," and its evidence is a holdout, an A/B test, or a staged-rollout baseline that lets it compare against a world where the AI was absent. When challenged, it can isolate the AI's contribution from the noise, because it built the comparison in from the start. Its risk is small, and more importantly it knows what the AI actually did — good or bad — which is the only basis for deciding whether to scale it, fix it, or kill it.
Same deployment. One reported activity and produced a flattering number no one could defend; the other measured against a counterfactual and produced a defensible one — and only the second would survive a CFO's scrutiny.
Where this argument runs out
This frame has limits, and they are real.
Counterfactuals are expensive and sometimes impossible, and demanding a randomized control for every AI deployment is its own failure. Some systems cannot ethically or practically be held back from a group, some effects are too diffuse to isolate cleanly, and the cost of a rigorous counterfactual can exceed the value of the certainty it buys for a small deployment. The discipline is to climb as high up the ladder as the stakes justify — a low-stakes internal tool may rationally stop at output, while a major investment demands the counterfactual — not to treat the top rung as mandatory everywhere. There is also a cost to over-measuring: an organization so consumed with proving ROI that it delays every decision until the evidence is airtight will move too slowly, and some bets should be made on weaker evidence precisely because the cost of measurement exceeds the cost of being wrong. And some genuine value is real but legitimately hard to measure — strategic positioning, organizational learning, optionality — and refusing to count what you cannot counterfactually prove will systematically undervalue exactly the long-horizon bets that matter most. The ladder is a guide to how strong your evidence is, not a mandate that only top-rung evidence counts.
That bounds the claim. Match the rigor to the stakes, do not let measurement paralyze decisions, and leave room for value that is real but hard to isolate. The point is not that everything needs a randomized trial; it is to know which rung your evidence is on and to stop calling activity an outcome.
The decision
So the move, before you next report on whether your AI is paying off, is concrete.
Locate your evidence on the ladder honestly — and if it is sitting on activity or output, do not present it as outcome or proof. For the deployments whose stakes justify it, build the counterfactual in from the start: a holdout group, an A/B test, or a staged rollout that gives you a baseline to compare against, designed before launch rather than reconstructed after. Match the rigor to the stakes, climbing higher up the ladder for bigger bets and accepting lower rungs for smaller ones. And hold the bidirectional discipline: be as suspicious of flattering numbers that would credit the AI for gains it did not cause as of the absence of numbers that might be hiding value it did.
It is as easy to claim credit the AI did not earn as to miss value it genuinely created, and a usage dashboard guards against neither. The honest question is never "did the metric move" but "did the AI move it," and only the counterfactual rung answers it. Know which rung you are standing on, build the comparison the stakes deserve, and stop mistaking attribution theater for evidence. The cost side of this ledger is the total-cost-of-ownership discipline from the companion piece on the CFO business case; the moment a deployment earns its place at the top of the production gradient — scaled and paying off — is exactly the moment the counterfactual is worth building.
Sources
- MIT NANDA — The State of AI in Business 2025. Finding that the large majority of enterprise GenAI pilots show no measurable P&L return — as much a measurement problem as a value one.
- McKinsey — The State of AI (annual survey). The persistent difficulty enterprises report in measuring and attributing value from AI investments. https://www.mckinsey.com/capabilities/quantumblack/our-insights/the-state-of-ai
- Deloitte — State of Generative AI in the Enterprise (2024–2025). Demonstrating and measuring value among the recurring obstacles to scaling AI. https://www2.deloitte.com/
Bottom-line summary (one line)
Most AI ROI proves the AI was present, not that it caused the result — so climb the Value Attribution Ladder (anecdote, activity, output, outcome, counterfactual), build a holdout or A/B baseline for high-stakes deployments, and stop calling activity an outcome.
Suggested LinkedIn hooks (link back to the blog)
- Everyone is measuring AI ROI. Almost no one is measuring it honestly. Usage dashboards prove the AI was present when something good happened — not that it caused it. [link]
- The question is never "did the metric move." It's "did the AI move it." Most AI ROI substitutes the easy question for the hard one and calls the answer proof. [link]
- Anecdote, activity, output, outcome, counterfactual. Every rung below the top is consistent with the AI delivering nothing. Only the counterfactual rules that out. [link]